
Skip to content
Self Science Institute
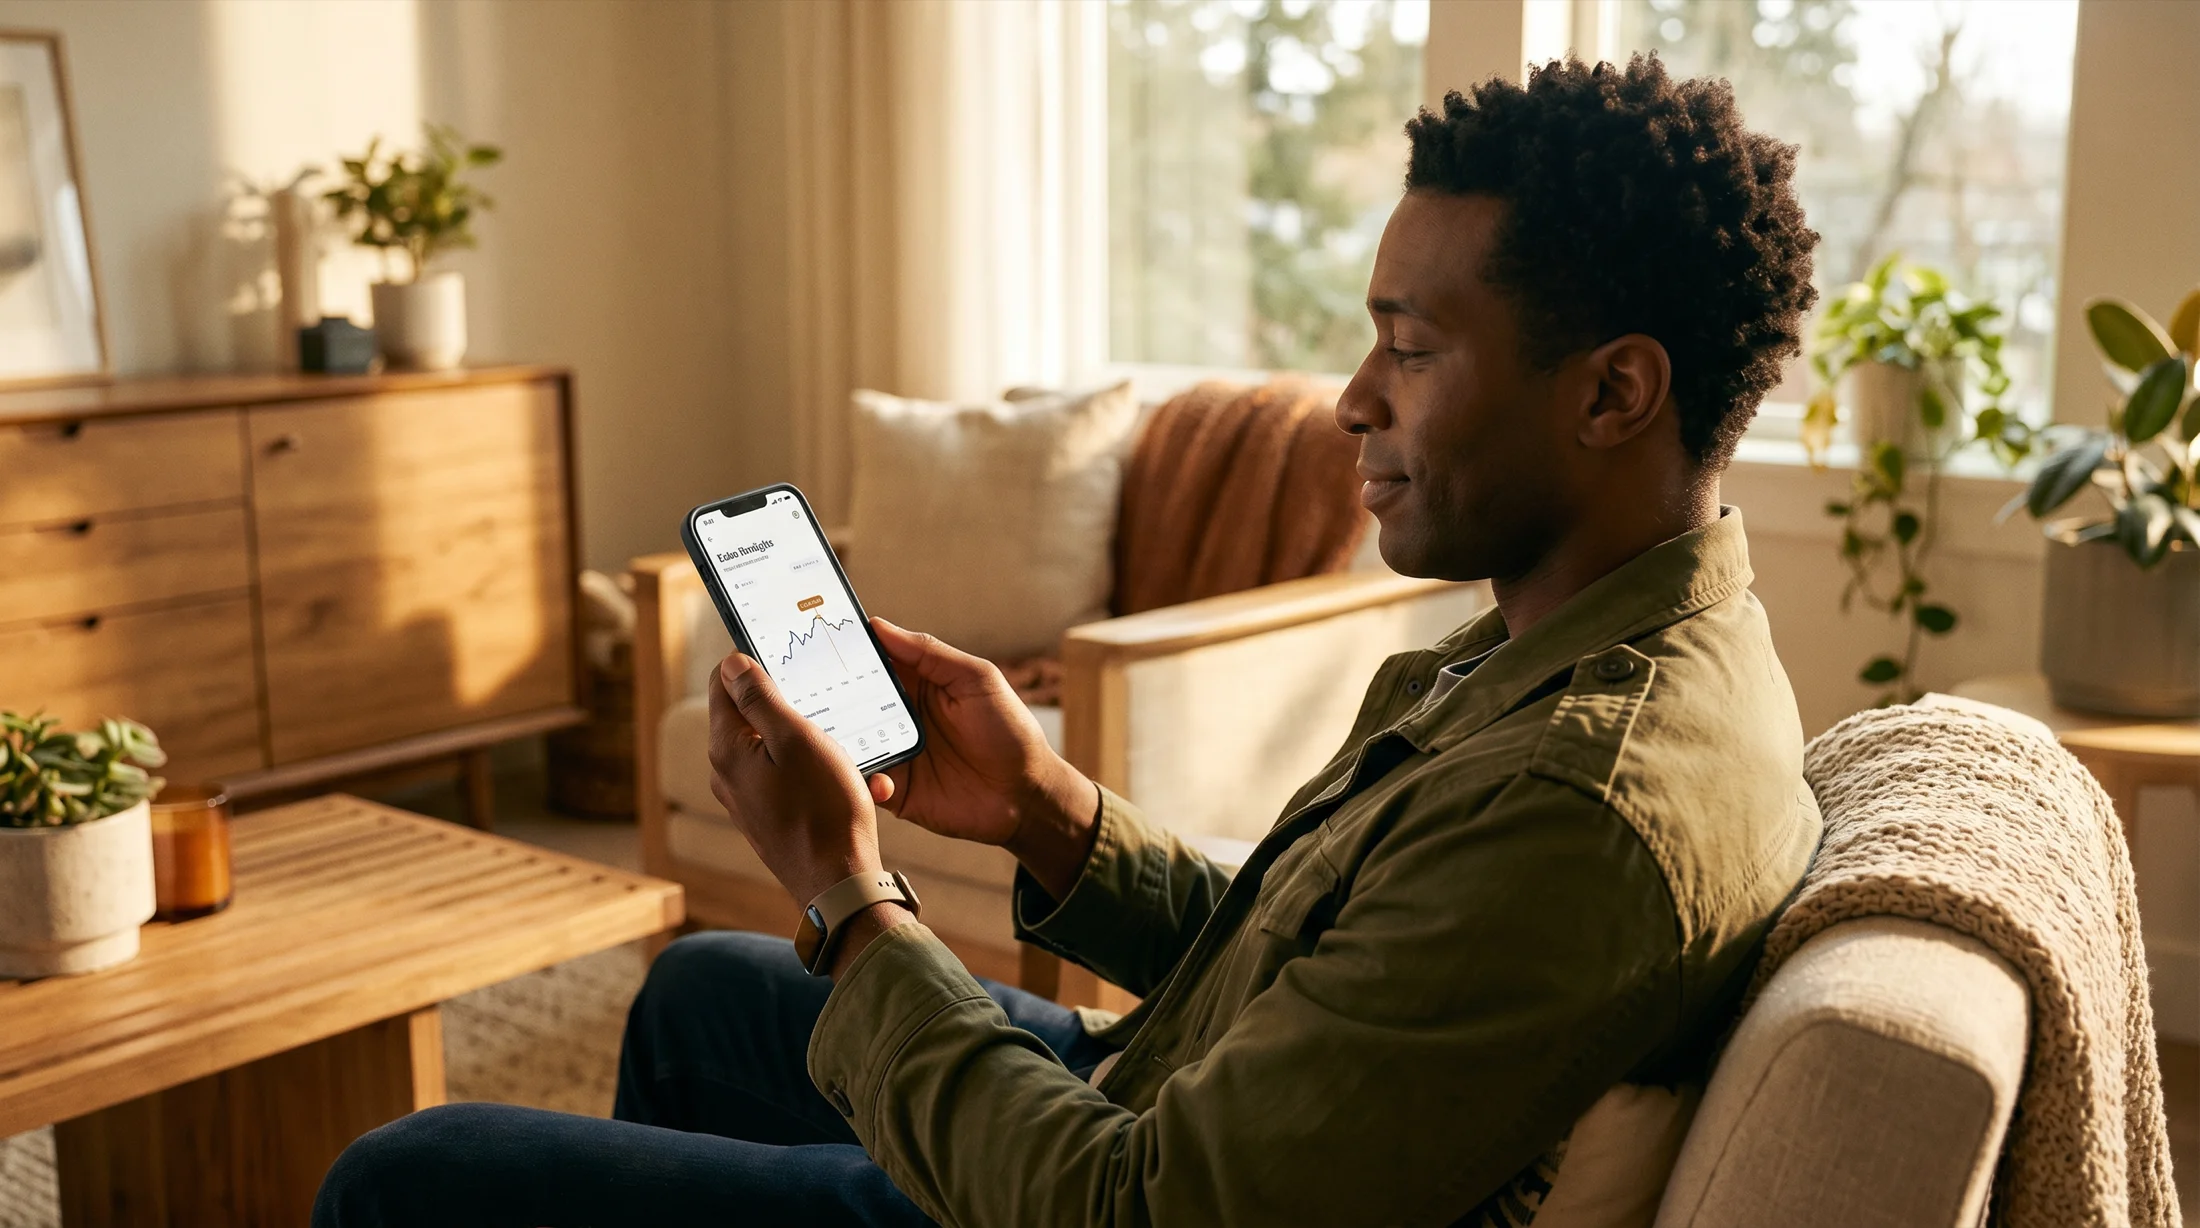
A person checking the SSI app on their phone at home

Platform

One platform, from design to signal to decision

The SSI team and platform guide practitioners and researchers through the design and deployment of real-world data collection studies and evidence-based, personalized healthcare.

Deployment is facilitated through our Stations - a self-service point-of-care hub for pre- to post-intervention assessments in clinics, health centers, and workplaces - and our mHealth App, which extends these insights through continuous 24/7 monitoring of sleep, stress, recovery, activity, and other physiological markers in everyday life.

Our platform collects research-quality sensor data from tablet or smartphone onboard sensors and attached external wearable biosensors. Data is by design organized and stored in a safe and structured manner to support research and clinical standards. Our services support SSI-hosting or self-hosted solutions.

Sensors & Signals

Blood Oxygen Saturation (SpO2)
Respiratory Rate
Heart Rate
Heart Rate Variability (+15 HRV metrics)
Photoplethysmography (PPG)
Electrocardiogram (ECG)
Acceleration
Gyroscope
Blood Pressure
Electroencephalography (EEG)
Magnetometer
fNIRS
Atmospheric Air Pressure
Temperature
Device Battery
Event Marker
Skin Conductance (EDA/GSR)
Step Counts
Activity Classes
Body Position
Device Temperature

The SSI Approach

Translating physiology into human understanding

By connecting multimodal physiological sensing and real-world context with scientific rigor, SSI transforms complex data into meaningful insights for individuals, practitioners and researchers. The platform is built to evolve as new research, technologies and applications emerge.

The SSI Approach

  1. Practice

    Integrating personalized, evidence-based protocols

  2. Signals

    Multimodal data and wearables

  3. Patterns

    State-of-the-art analytics and AI

  4. Understandings

    Harmonizing scientific data with inner experience

  5. Better decisions

    Stronger insights, better outcomes

Three products, one platform

Meet clients where they are

SS Stations

In your clinic

Biofeedback during sessions - no app, no subscription for your clients. Every walk-in, measured. Your logo, your colours, your brand.

SS App

Between sessions

Continuous 24/7 monitoring for the clients who want to stay engaged. "Pocket therapy" that keeps them connected to your care - and becomes a recurring revenue stream for you.

Live Biofeedback

Live, together

A shared session where everyone wears a sensor and watches their own - and the group's - physiology unfold live: yoga, breathwork, spinning, a physiotherapy group, a conference demonstration. Keep the data for later review and research, and a live moment becomes part of the longitudinal record - in the clinic or on the conference stage.

Stations meet clients in the clinic. The App walks with them through their week. Together they make the bundle: you stay with them - and they stay with you.

Together, Stations and the mHealth App capture one rich, multimodal picture. This includes physiological data (e.g., ECG, EEG, i.a.), contextual data (e.g., GPS), behavioral data (e.g., sleep or steps), patient-reported data (e.g., questionnaires), and cognitive assessments (e.g., reaction time assessment).

Analytics

Three levels of depth

Every signal is handled with the same scientific care - the levels differ in how deep the analysis goes, and who it serves.

Basic analytics

Everyday clarity

Heart rate, HRV, breathing rate and RR intervals - reliably derived from standard consumer wearables (PPG). Clear, understandable feedback per person and per day. No study analytics.

Advanced analytics

Raw signals, full picture

Here we analyze the raw signals themselves - ECG and EEG - with our full biomedical pipeline: waveform morphology, coherence, event-related potentials. Not only rhythm-derived numbers.

Study analytics

Evidence at practice level

The whole practice in view: cohort overviews, comparisons across studies, provider-level and conclusive reports - publication-ready.

Deployment

Two ways to host

SSI-Hosted

We run everything. EU-native, secure, GDPR-compliant, zero setup. Focus on your clients; we handle the data and the science.

Self-Hosted

The platform runs on your servers; your data never leaves your control. We deploy, migrate, validate and train your team. Built for researchers, hospitals and anyone with strict data-sovereignty needs.

However you host, sessions can also go live: the Biofeedback Engine streams many participants' signals - multiple sensors, multiple signal types - into one synchronized picture, on a screen in the room or on any phone with a web code. Not one number from one brand of sensor: the whole room, live.

Deliverables

Concrete decision support, not just data

The deliverables are personalized reports and insights delivered to the practitioner, researcher, or end-user according to the chosen reporting frequency.

Instant session report

After each in-clinic session - biofeedback summary of HRV, breathing and brain activity, seen immediately.

Daily / weekly report

Continuous HRV trends, sleep quality and adherence, compiled from wearable monitoring.

Monthly study report

A provider's cohort overview - running results across all clients for ongoing decisions.

Conclusive study report

Auto-compiled scientific summary: design, N, methods, statistics - ready for white-paper polish.

Connected Sensor Ecosystem

Leading sensors, one unified platform

Sensors are supporting evidence, not the story. SSI integrates state-of-the-art biomedical signal processing and a study-analysis pipeline with leading sensor and monitoring technologies - across health, recovery and performance.

Muse, Oura, Apple Health, Polar, Whoop, Google Health, Movesense, Dexcom

Integrations expand continuously as the ecosystem matures.

Let's understand the human beyond the data - together.

Tell us where you want to go - your research, your clinic, your people - and we'll help you get there, grounded in science and centred on the person.